

How Has the Crypto Market Performed Over the Past 7 Years (2019–2026)?
The cryptocurrency market has experienced extraordinary growth, devastating crashes, and several major recovery periods over the past seven years. Investors who bought and held certain cryptocurrencies for the entire period achieved substantial returns, while others lost most or all of their investments.
The most important lesson is that the crypto market does not rise continuously. It moves in cycles, and different cryptocurrencies perform very differently.
Let’s examine what happened from 2019 to 2026, focusing on Bitcoin, XRP, and the wider crypto market, including what these historical trends might mean for long-term investors.
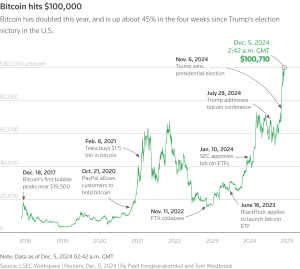
1. The seven-year crypto market timeline
Here are the major phases of the market.
| Year | Market performance | What happened |
| 2019 | Recovery after a major crash | Bitcoin recovered from its 2018 downturn, although many altcoins struggled. |
| 2020 | Strong growth | COVID-19, monetary stimulus, and growing interest in digital assets helped fuel a rally. |
| 2021 | Major bull market | Bitcoin reached approximately $69,000, while Ethereum and several altcoins surged. |
| 2022 | Severe bear market | Bitcoin fell approximately 65% from its 2021 year-end level, and major crypto companies collapsed. |
| 2023 | Recovery | Bitcoin rose as market sentiment improved and expectations around institutional investment grew. |
| 2024 | Strong rally | US spot Bitcoin ETFs launched, and Bitcoin reached new highs above $100,000. |
| 2025 | Continued volatility | Bitcoin and other crypto assets experienced further rallies and corrections. |
| 2026 | Market correction and volatility | Crypto prices have fluctuated substantially; the year is still in progress. |
Historical Bitcoin data supports the broad pattern of a strong rally in 2020–2021, a major decline in 2022, and a recovery in 2023–2024.
What does this tell us?
Crypto has gone through several distinct phases:
- Bull markets: Prices rise rapidly, and investors become optimistic.
- Bear markets: Prices fall, sometimes by 50–80% or more.
- Recovery periods: Prices rise again, but not every cryptocurrency recovers.
- Speculative bubbles: Some coins surge on hype and subsequently lose most of their value.
The danger is assuming that every cryptocurrency will eventually recover just because Bitcoin has recovered from previous downturns.
2. How much has Bitcoin grown?
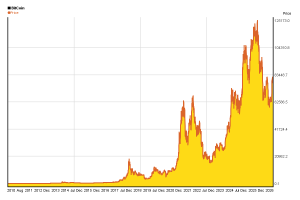
Bitcoin has been one of the strongest long-term performers in the cryptocurrency market.
Approximate historical year-end prices illustrate its growth:
| Year | Bitcoin price at year-end |
| 2019 | $7,194 |
| 2020 | $29,002 |
| 2021 | $46,306 |
| 2022 | $16,548 |
| 2023 | $42,265 |
| 2024 | $93,429 |
| 2025 | $87,502 |
Source: historical Bitcoin price data compiled by Capital.com. Values are approximate and may vary slightly between data providers.
Example: What if you invested $1,000?
Suppose you invested $1,000 in Bitcoin at the end of 2019, when Bitcoin was approximately $7,194.
You would have acquired approximately 0.139 Bitcoin.
Using the year-end prices above, your investment would have been worth approximately:
| Date | Approximate value of your original $1,000 |
| End of 2020 | $4,030 |
| End of 2021 | $6,440 |
| End of 2022 | $2,300 |
| End of 2023 | $5,880 |
| End of 2024 | $13,000 |
| End of 2025 | $12,200 |
These are illustrative values before fees and taxes, assuming you held the same Bitcoin throughout. They do not include any additional purchases.
The lesson: An investment can multiply several times over a long period and still suffer a devastating temporary decline along the way.
For example, an investor who saw their portfolio reach $6,440 at the end of 2021 would have seen it fall to approximately $2,300 by the end of 2022.
That is why long-term crypto investing requires both risk management and emotional discipline.
3. What about Ethereum?
Ethereum is the second major cryptocurrency to study because its technology supports smart contracts, decentralized finance, and many blockchain applications.
Its historical performance has been impressive, but its price has also experienced significant declines.
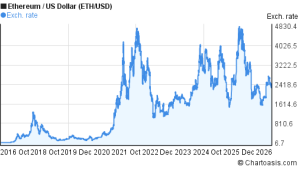
| Year | Approximate year-end ETH price |
| 2019 | $129 |
| 2020 | $738 |
| 2021 | $3,676 |
| 2022 | $1,195 |
| 2023 | $2,281 |
| 2024 | $3,330 |
| 2025 | $2,967 |
Source: historical Ethereum price data.
What if you invested $1,000 in Ethereum?
Suppose you invested $1,000 at the end of 2019, when ETH was approximately $129.
Your investment would have been worth approximately:
- End of 2020: $5,720
- End of 2021: $28,500
- End of 2022: $9,270
- End of 2023: $17,680
- End of 2024: $25,800
- End of 2025: $23,000
These figures are illustrative, calculated using the approximate year-end prices above. They exclude transaction fees and taxes.
Notice something important: Ethereum’s price increased enormously during the 2020–2021 bull market, but investors who bought near the top subsequently experienced severe losses.
This is why historical returns should not be mistaken for guaranteed future performance.
4. How has XRP performed over the past seven years?
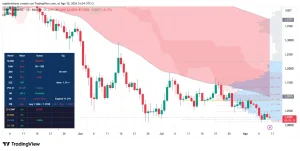
Since you’ve previously shown interest in XRP, this is particularly relevant to your investment strategy.
XRP has experienced several major rallies and declines. Its performance has not followed exactly the same pattern as Bitcoin or Ethereum.
Here is an overview of its calendar-year returns from one historical price series:
| Year | XRP’s approximate annual return |
| 2019 | -47% |
| 2020 | +14% |
| 2021 | +278% |
| 2022 | -59% |
| 2023 | +82% |
| 2024 | +238% |
| 2025 | -12% |
| 2026 | Negative year to date |
Source: historical XRP price data compiled by CoinSeekly. The 2026 figure is provisional, and returns differ slightly across data providers and measurement dates.
What does XRP’s history teach us?
First, XRP can produce substantial gains during favourable market conditions.
For example, its reported annual return was approximately 278% in 2021 and 238% in 2024.
Second, XRP can also experience severe declines.
Its price performance was negative in 2019 and 2022, and it declined again in 2025.
Third, a promising cryptocurrency is not necessarily a safe investment.
XRP’s price can be affected by market sentiment, regulatory developments, adoption, competition, and the broader financial environment.
If you are investing in XRP over five years or longer, you should be prepared for the possibility of significant drawdowns. There is no guarantee that XRP will repeat its previous rallies.
5. How much has the entire cryptocurrency market grown?
Bitcoin, Ethereum, and XRP are only part of the market. Thousands of other cryptocurrencies compete for investment.
The total cryptocurrency market capitalization provides a broader picture.
| Year | Approximate total crypto market capitalization at year-end |
| 2019 | $192 billion |
| 2020 | $772 billion |
| 2021 | $2.3–$2.5 trillion |
| 2022 | $830 billion |
| 2023 | $1.7–$1.75 trillion |
| 2024 | $3.4 trillion |
| 2025 | $3.0 trillion |
These figures are approximate historical estimates; different data providers may report different totals depending on their methodology.
The market expanded enormously between 2019 and 2024, but the subsequent decline illustrates that even an expanding industry can experience substantial losses.
As of October 30, 2026, one market-data provider reported total crypto market capitalization of approximately $2.58 trillion.
Three important observations
- Crypto has grown into a multitrillion-dollar asset market. It is no longer a small market consisting only of early Bitcoin adopters.
- Market growth does not mean every coin becomes more valuable. Capital can concentrate in Bitcoin and other established assets while smaller tokens lose relevance.
- The market can lose trillions of dollars in value during downturns. Investors must consider the amount they could lose, not just their potential profits.
6. Why does crypto move in cycles?
Several factors help explain the market’s historical behaviour.
A. Bitcoin halving
Bitcoin’s protocol reduces the rate at which new bitcoins are created approximately every four years.
Historically, the halvings in 2020 and 2024 occurred before major market rallies. However, this does not establish that each halving causes a bull market or that the next one will produce the same returns.
B. Interest rates and monetary policy
When interest rates fall and financial conditions become more favourable, some investors become more willing to hold risky assets.
When interest rates rise or liquidity tightens, speculative assets can come under pressure.
The relationship is not automatic: crypto prices also respond to other economic and market developments.
C. Institutional investment
The introduction of US spot Bitcoin exchange-traded funds in January 2024 created another route for investors to obtain Bitcoin exposure through traditional financial markets.
This helped broaden access to Bitcoin, although institutional participation does not eliminate its volatility.
D. Investor psychology
Crypto markets can be strongly influenced by fear and greed.
During rallies, investors may buy because they fear missing out. During crashes, they may sell because they fear further losses.
Buying during extreme excitement and selling in panic can undermine an otherwise sensible long-term investment strategy.
7. What does this mean for someone investing for the next five years?
Based on the historical evidence, I would separate crypto investments into three broad categories.
| Category | Examples | Main consideration |
| More established crypto assets | Bitcoin, Ethereum | Longer histories and broader adoption, but still substantial risk |
| Other established cryptocurrencies | XRP, BNB, Solana | Different use cases and risks; returns can differ considerably from Bitcoin |
| Highly speculative tokens | Small-cap meme coins and lesser-known tokens | Greater risk of extreme losses, low liquidity, or permanent loss of value |
This is a general educational classification, not a guarantee that assets in the first category will outperform those in the others.
If you invest monthly
Suppose you invest ₦20,000 every month for five years.
Your total contributions would be:
₦20,000 × 60 months = ₦1,200,000.
Your eventual portfolio value would depend on the price at which you bought each asset, the value of your holdings at the end of the five years, and any transaction fees.
You could end up with substantially more than ₦1.2 million, but you could also end up with less than you contributed.
Regular investing spreads your purchases over time, but it does not guarantee a profit or protect you from a prolonged downturn.
For an investor whose income and expenses are in naira, there is an additional consideration: changes in the naira-to-dollar exchange rate can affect the naira value of a crypto investment even when its dollar price changes very little.
Understanding the Risks of Cryptocurrency Investing
Although cryptocurrency has delivered substantial returns during certain market cycles, investors should never assume that prices will continue rising. Bitcoin, Ethereum, XRP, and other digital assets can experience significant declines, potentially causing investors to lose a substantial portion of their capital. Before investing, read our guide on the hard truth about investing and how to protect yourself. You can also consult the US Securities and Exchange Commission’s guide to crypto asset-related investments to understand the risks.
Comparing Cryptocurrency With Other Investments
Cryptocurrency is only one option for people seeking to build wealth over time. Depending on your financial goals and tolerance for risk, you may also consider traditional investments that offer growth potential or dividend income. Explore our guide to building a dividend portfolio that could generate $1,000 a month to understand how dividend investing differs from relying on cryptocurrency price appreciation.
Researching Historical Cryptocurrency Performance
Historical prices can help investors understand how Bitcoin, Ethereum, and XRP have performed during previous bull and bear markets. However, past performance does not guarantee future returns. You can explore historical cryptocurrency prices and market data on CoinGecko to examine price movements and compare different digital assets over time.
8. My conclusion after examining the seven-year history
The crypto market has provided exceptional opportunities for investors who held the right assets through favourable periods. However, the same history demonstrates how quickly profits can disappear.
Three lessons stand out:
- Bitcoin has demonstrated substantial long-term growth, but it has also experienced deep bear markets.
- Ethereum and XRP have produced significant rallies, but their performance has varied considerably across market cycles.
- Smaller cryptocurrencies are not guaranteed to recover, even when Bitcoin and the broader market rebound.
Past performance does not guarantee future returns, and the next seven years could look very different from the previous seven.
One question for you
Since you have previously considered investing in XRP and CAW, alongside fixed-interest investments and Nigerian stocks, I can take this analysis one step further.
Which would you like me to examine?
- How ₦100,000 invested monthly in Bitcoin, XRP, or CAW over the next five years might perform under different scenarios.
- The historical four-year crypto cycle and whether 2026–2030 could present another major opportunity.
- A comparison of Bitcoin, XRP, and CAW to identify which has the strongest case for long-term investing.
- How much someone who invested ₦10,000 monthly in Bitcoin, XRP, or CAW seven years ago would have accumulated, using historical prices and accounting for the difficulty of reconstructing past naira exchange rates.
